US Census has interactive tool to measure Covid vaccination rates, hesitancy over time.
By Curt Anderson August 14, 2021 1:56 pm Category: Health (0.0 from 0 votes)
Rules of the Post
New Tool Tracks Vaccination and Vaccine Hesitancy Rates Across Geographies, Population Groups
Who is getting a COVID-19 vaccine? Who is hesitant about receiving it and why? What state has the highest vaccination or hesitancy rate?
The rollout of COVID-19 vaccines has been the subject of extensive news coverage and a new U.S. Census Bureau data visualization tool aims to provide insights into the public�s feelings about COVID-19 vaccines in near real time.
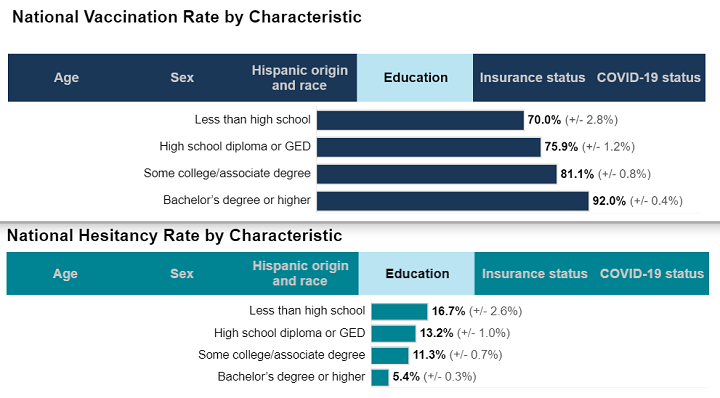
Incidentally, when the Less than high school were asked for the January 18th survey, they were 28.8% probably not or definitely not getting vaccine. Bachelor's degree or higher were 12.1% probably not or definitely not getting vaccine.
By August 2, those two groups were 16.7% and 5.4% respectively. In other words of the less educated, 58% were still vaccine hesitant. The better educated but hesitant dropped to 44.6 of their original group's size.
The views and claims expressed by contributors are their own and do not necessarily reflect the views and beliefs of SelectSmart.com. Not every statement made here can be assumed to be a fact.
Comments on "US Census has interactive tool to measure Covid vaccination rates, hesitancy over time.":
Be the first to comment on this article.
Comment on: "US Census has interactive tool to measure Covid vaccination rates, hesitancy over time."


 New Tool Tracks Vaccination and Vaccine Hesitancy Rates Across Geographies, Population Groups